

Capturing images of spectra using a tripod-mounted Aruna-1 spectrometer and a digital camera with manual focus and exposure settings opens up use of the instrument for recording and communicating your observations, and for performing quantitative analysis of the spectra. Some utility hardware and software are described below. These items are only examples of some available hardware and software. Other avaialable hardware and software may also be used for the same purpose.
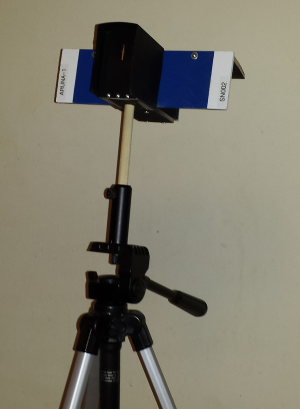
The hand grip on the spectrometer may need to be sanded to reduce the diameter by a very small amount in order to slip into the 1/2" post holder. Be sure to remove the grating card and cover the entrance slit if you need to sand the hand grip, so dust does not fall on these surfaces.
After images of the spectra are recorded with the camera and transferred to a computer, the spectra may be processed using various software. We use the free GNU Image Manipulation Program, gimp, to clip the spectral region from the image, apply rotations, adjust brightness and contrast, and save the resulting image to a png image file.
Quantitative analysis of the spectra may be performed by further reducing the image data to a spectral line profile, using other image processing software. A simp program which allows a range of image rows from a png image file to be summed to give an intensity versus wavelength data set is SpectrumProfile.R, for use with the free computing environment, R.