Version(s) 4.1
XYPLOT may be used to generate simple functions such as
Use the Math function Template to generate
a set of uniformly spaced points with y = x:
- Upon starting XYPLOT, the current directory will be displayed and
you will be prompted to enter a data file name. Simply press
Enter to create your own template dataset. If a data
file has already been loaded, click on the Math menu
and select Template.
- Enter x1, x2, and dx to specify the lower limit,
upper limit, and step size for the set of points, e.g.
-10, 10, 0.5
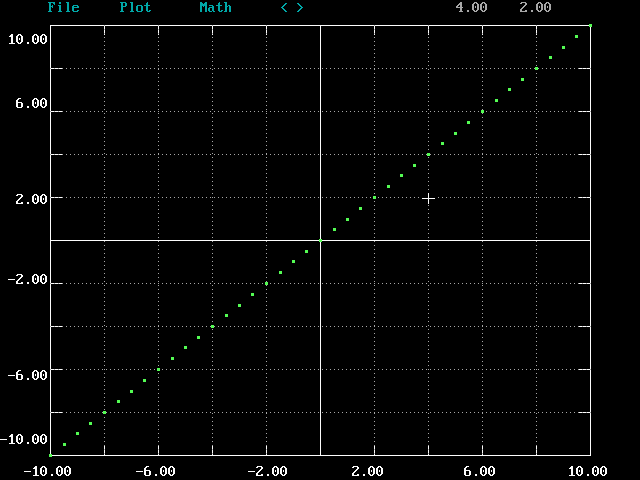
Data for the function y = x is generated over the
specified interval and plotted. The dataset generated
by the Template function may be operated upon with
other Math functions such as
Rescale and
plot Arithmetic to build up more complex functions
as illustrated in the examples below.
Use the Template
and Rescale operations
in sequence to create a dataset with the values
y = sin(x) over the interval (-6.28, 6.28):
- Click on the Math menu and select Template.
- Enter values for x1, x2, and dx: -6.28,6.28,0.1
- Click on the Plot menu, then the Symbol menu,
and select Line to switch from a point plot to a line plot.
- Click on the Math menu and select Rescale.
- At the prompt, enter the expression sin(y).
Sine Wave Image
Generate the two functions given in the previous examples,
y = sin(x) and y = x, then divide one by the other
to generate the sinc function, y = sin(x)/x:
- Generate y = x over the interval (-20, 20), with a
step size of 0.1.
- Generate y = sin(x) over the same interval (-20, 20)
and with the same step size. The Plot List at the top of
the screen will show the active plot to be plot 2 and the
operand plot to be plot 1.
- Click on the Math menu, then the Arithmetic menu,
and select Divide. The dataset for plot 2 will be divided
by the dataset for plot 1 to create a new dataset, which will be
displayed as plot 3. This is the sinc function.
- In order to see the sinc function better, you may remove
plots 1 and 2 from the plot display. First select the plot
to be removed by pressing the number key of that plot to
make it the active plot, then click on the Plot menu
and select Drop to drop the plot from the display.
Sinc Function Image
Polynomials of up to 9th order may be generated
easily using Template and the Rescale function
pol. In this example we will generate the 5th
order polynomial y = 1 + x + x5:
- Generate the function y = x over the interval
(-2, 2) with a step size of 0.01 (see
Example 1.1).
- Click on the Math menu and select Rescale. At
the prompt, enter the expression pol(y,1,1,0,0,0,1).
The numbers in the expression represent the polynomial
coefficients starting with the 0th order coefficient.
Polynomial Image